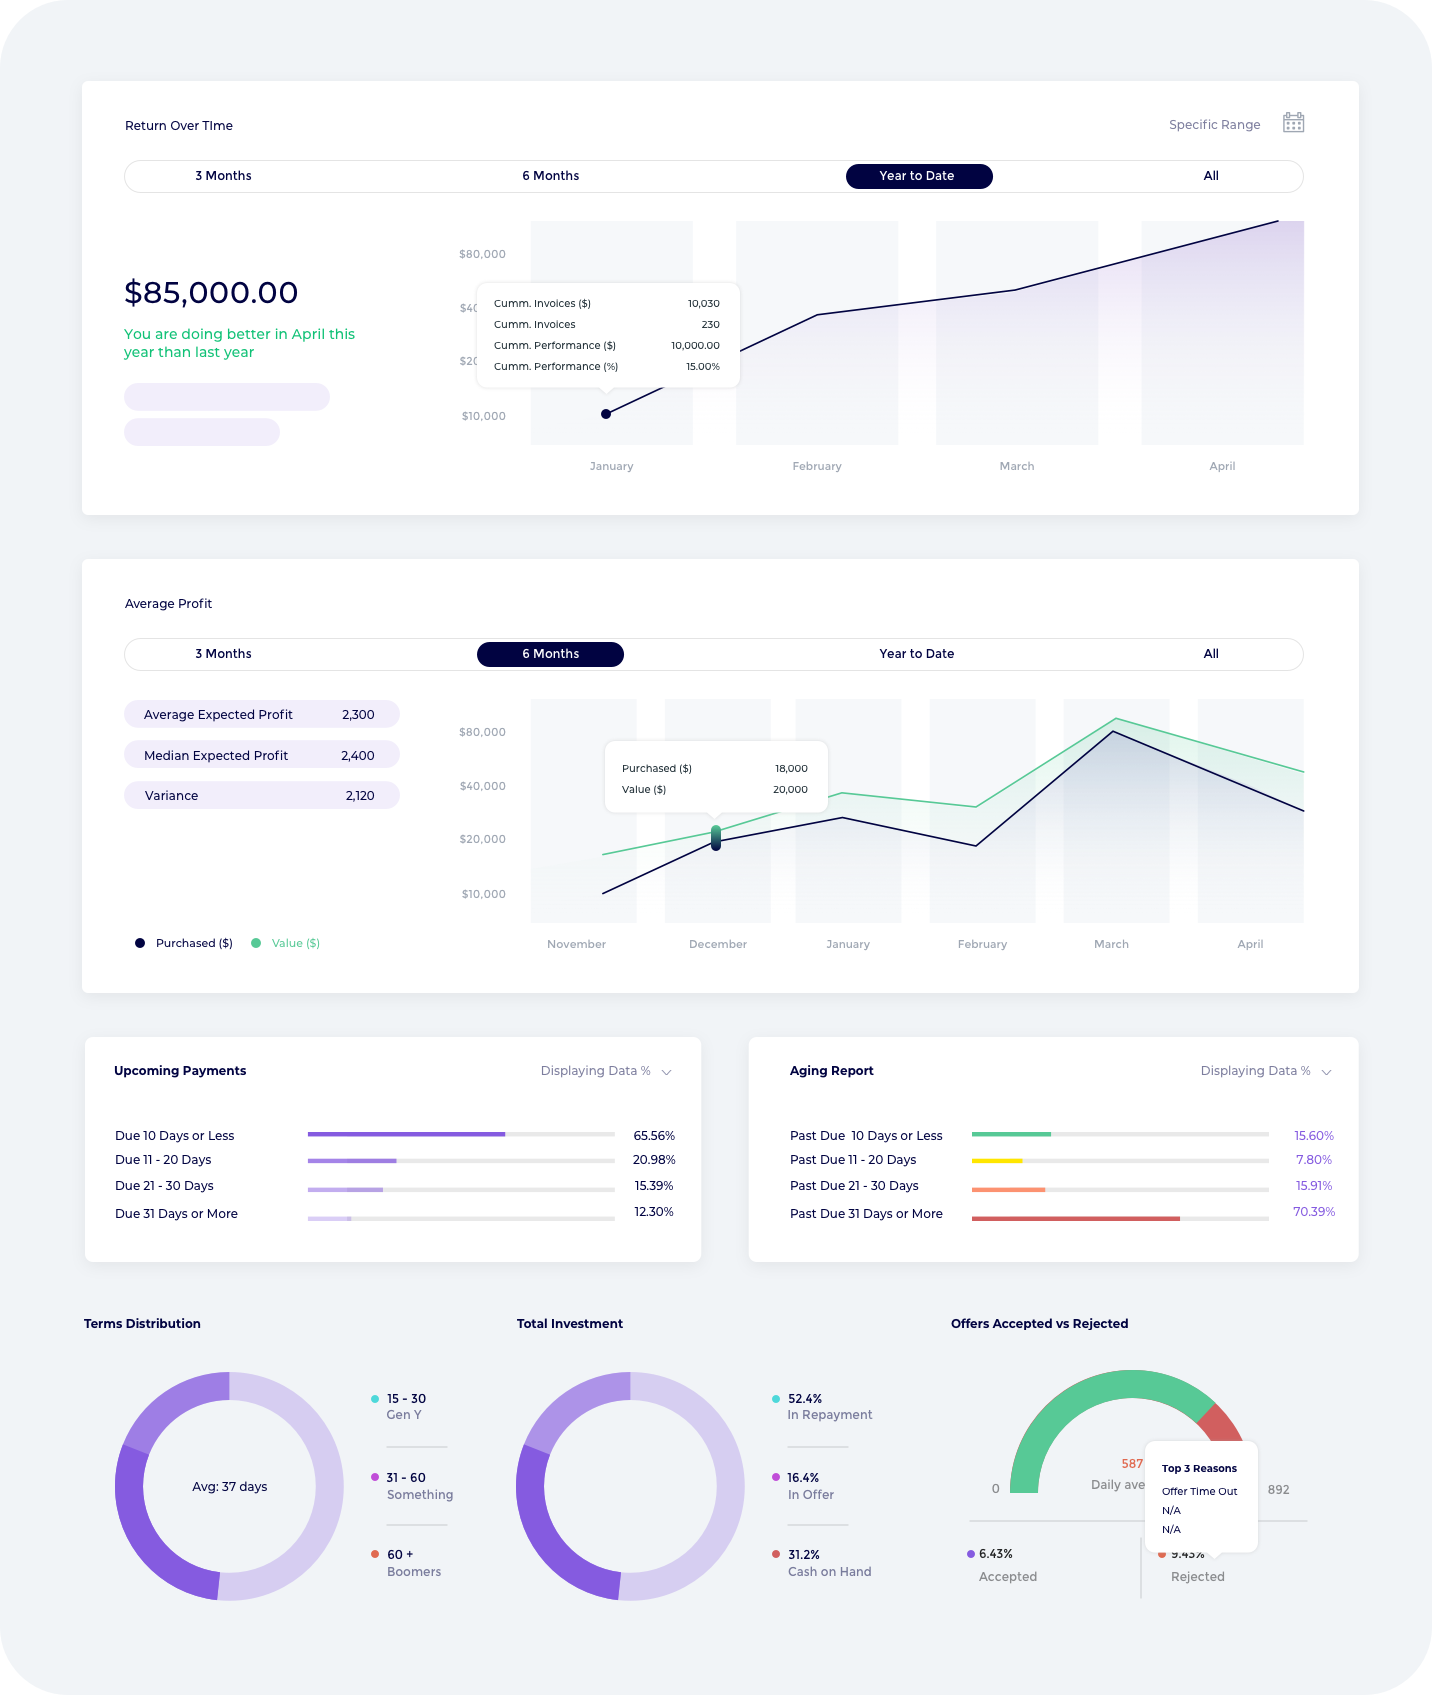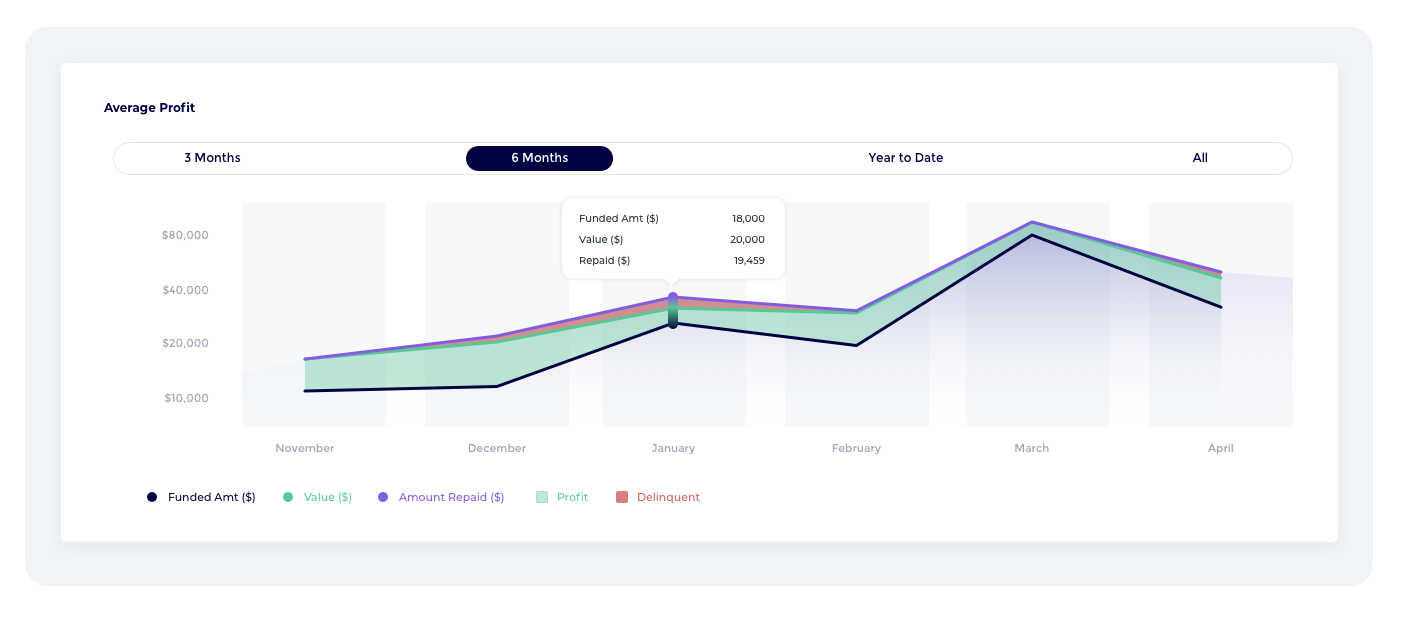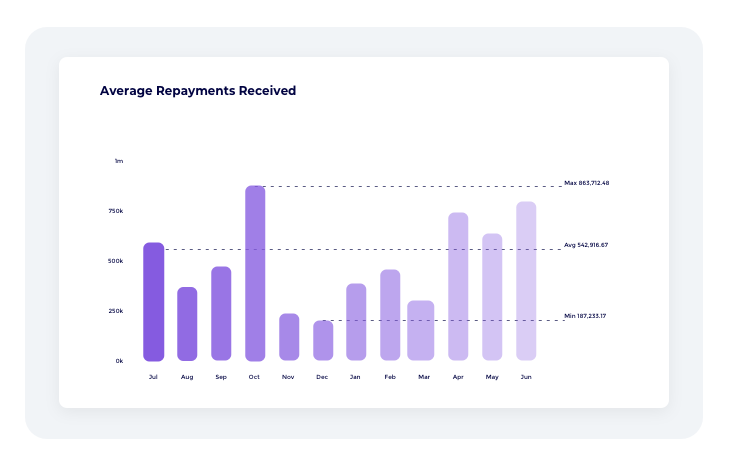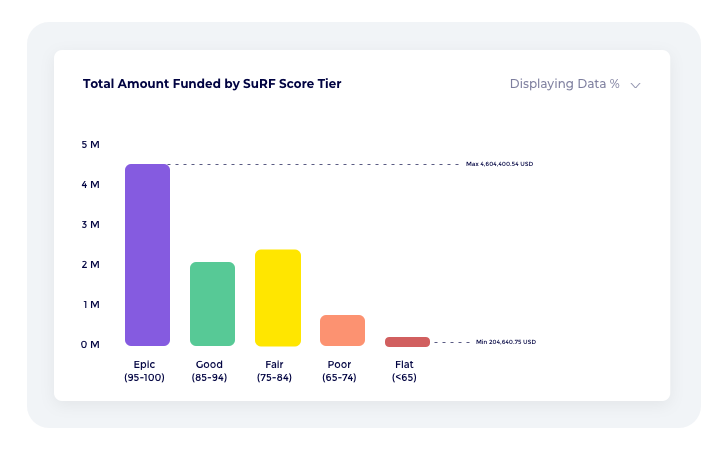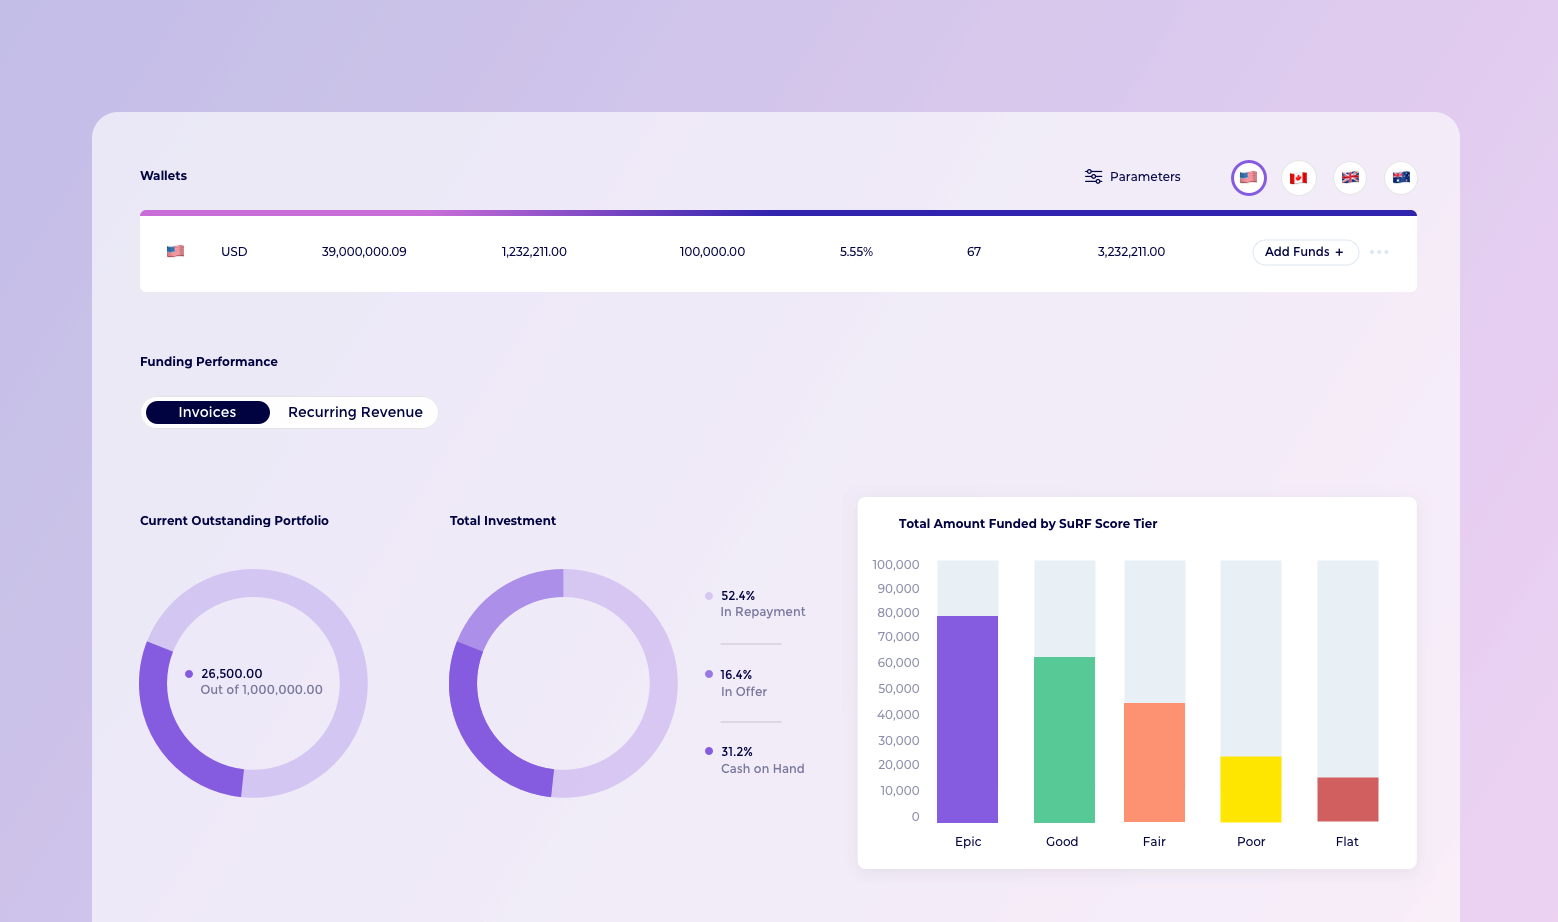
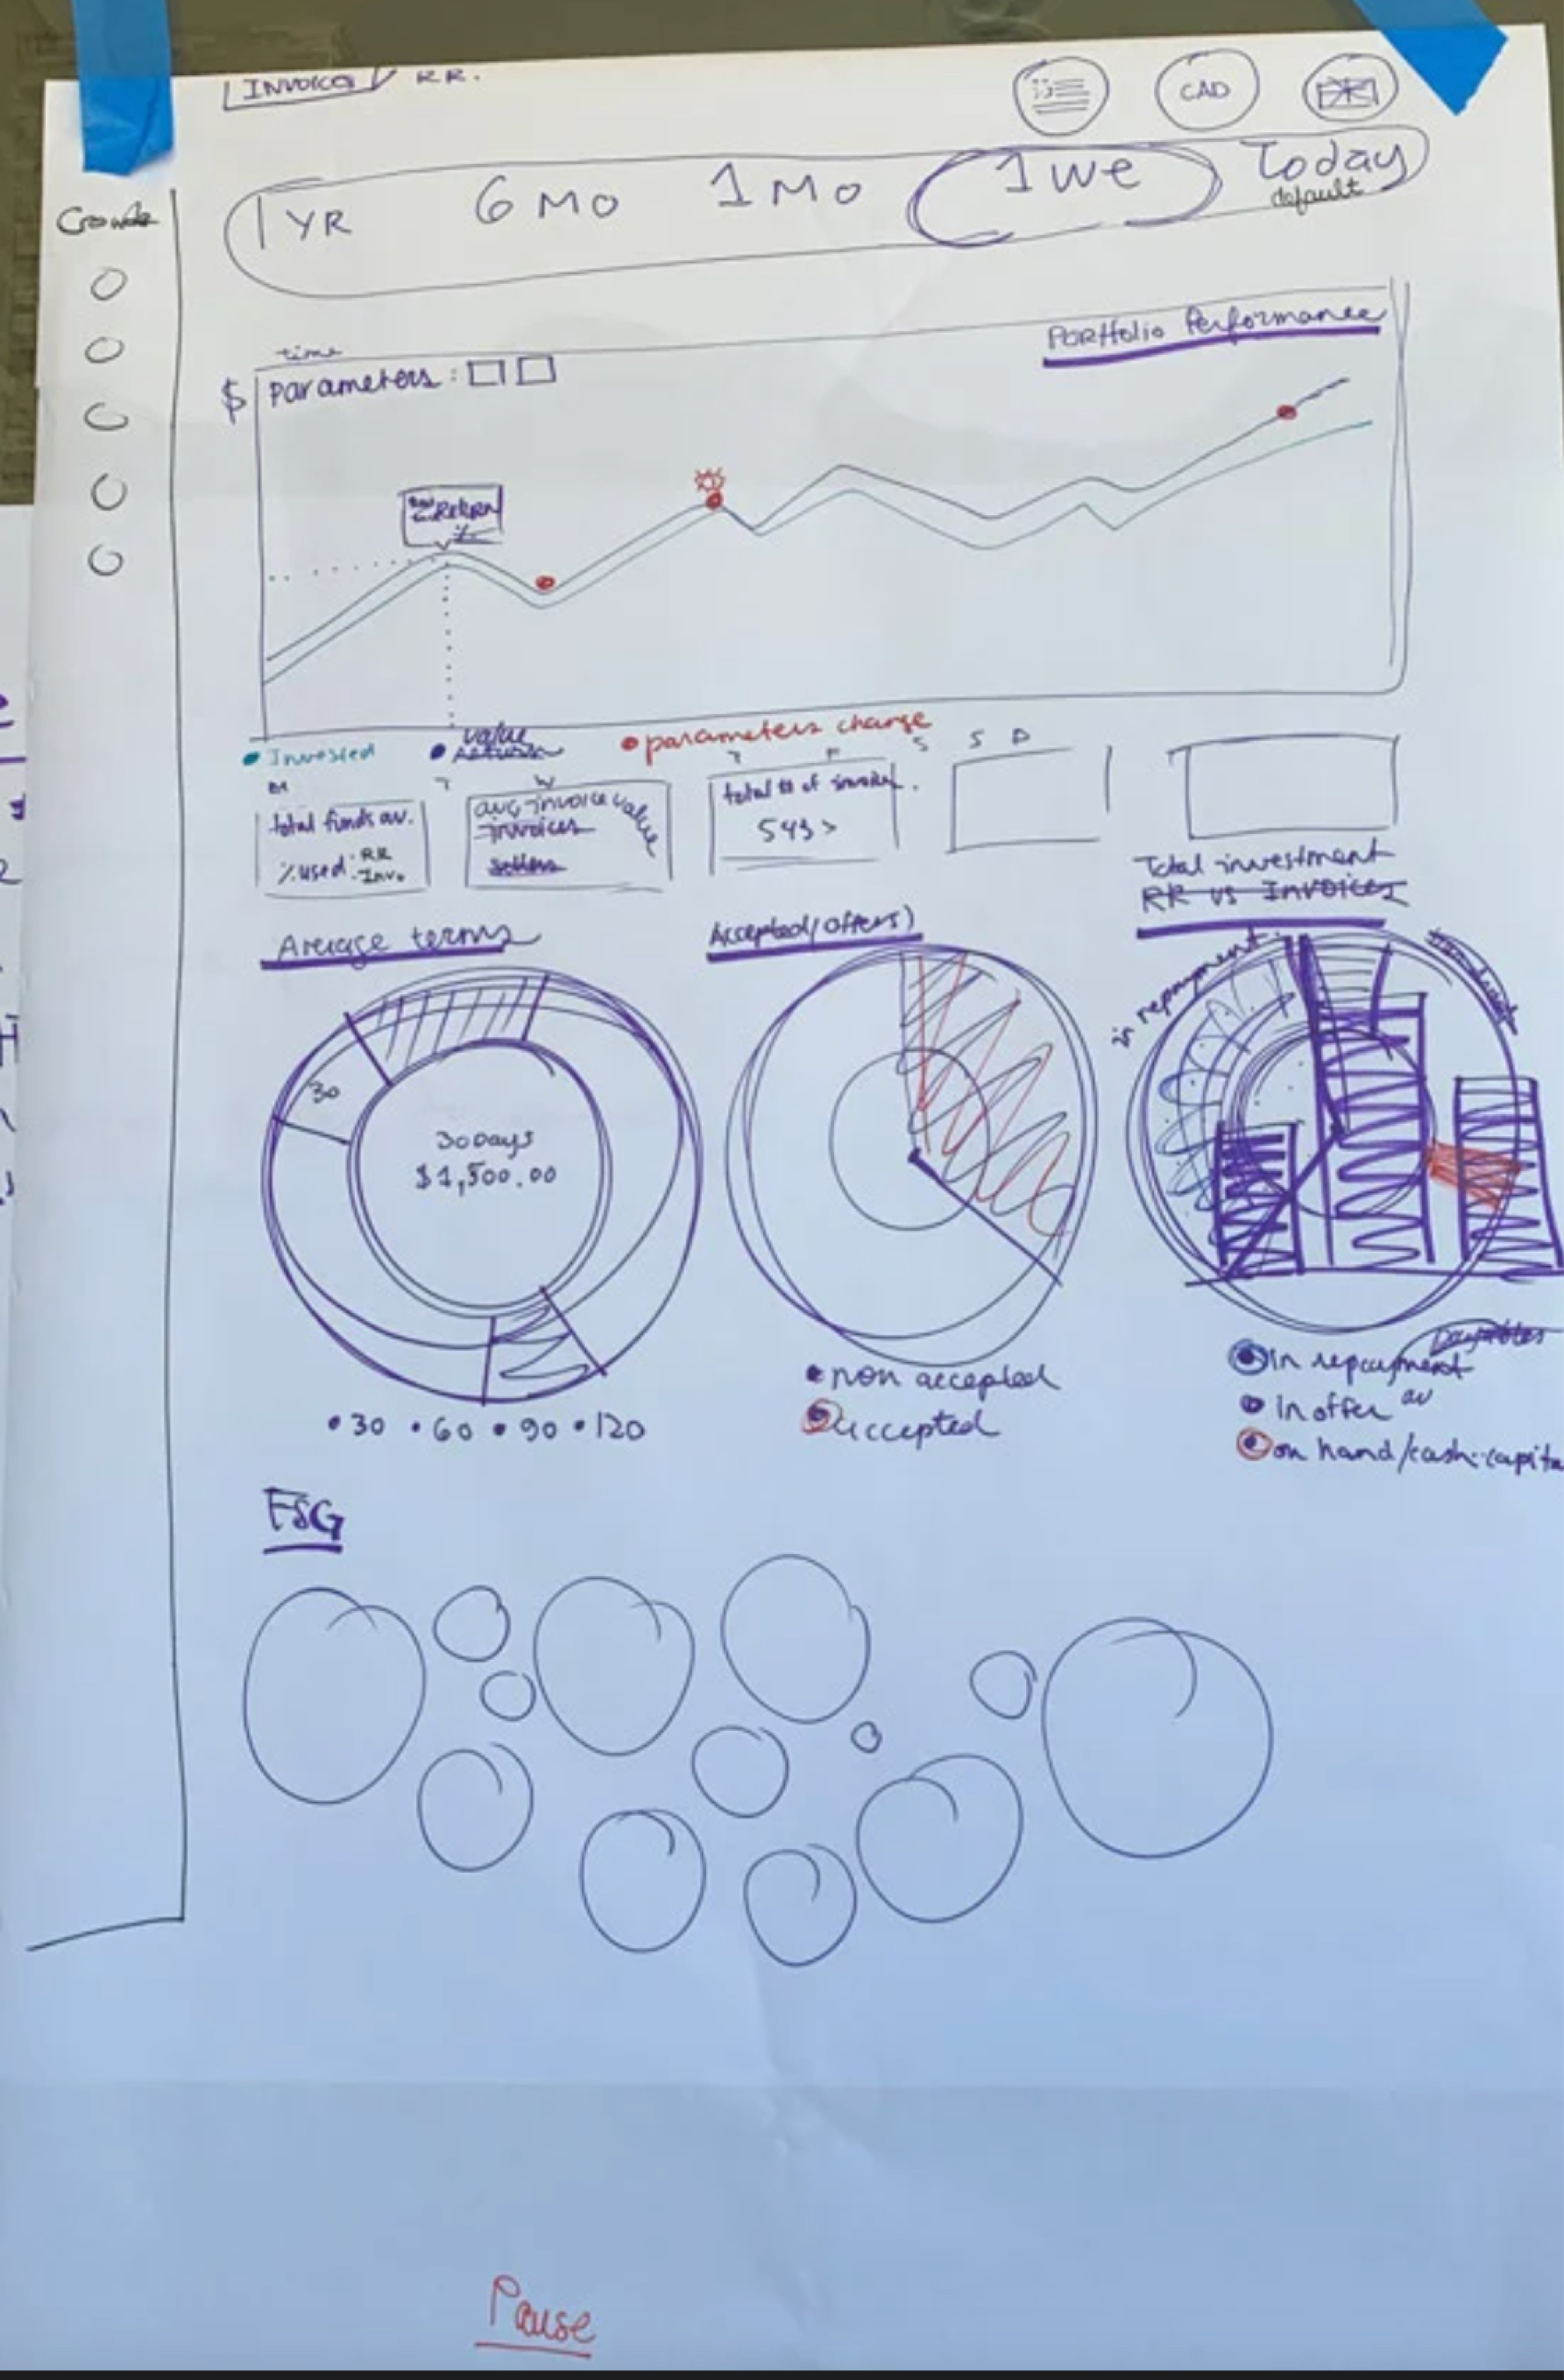
One of the draft we did prior to our high res mockups. We gathered notes from funders and investors and organized them by 'must-have' and 'good-to-have'. During our working session, we also called in financial savvy resources to confirm some elements. From this draft, we created the high-res dashboard that can be seen below.